Undergraduate at Fuzhou University (Resource Exploration Engineering & Finance), with cross-disciplinary experience across asset management, securities, mining and mining rights evaluation.
A Spatial Machine Learning Model Integrating Remote Sensing & GIS for Dynamic Monitoring of Ecological Disturbance in Mining Areas
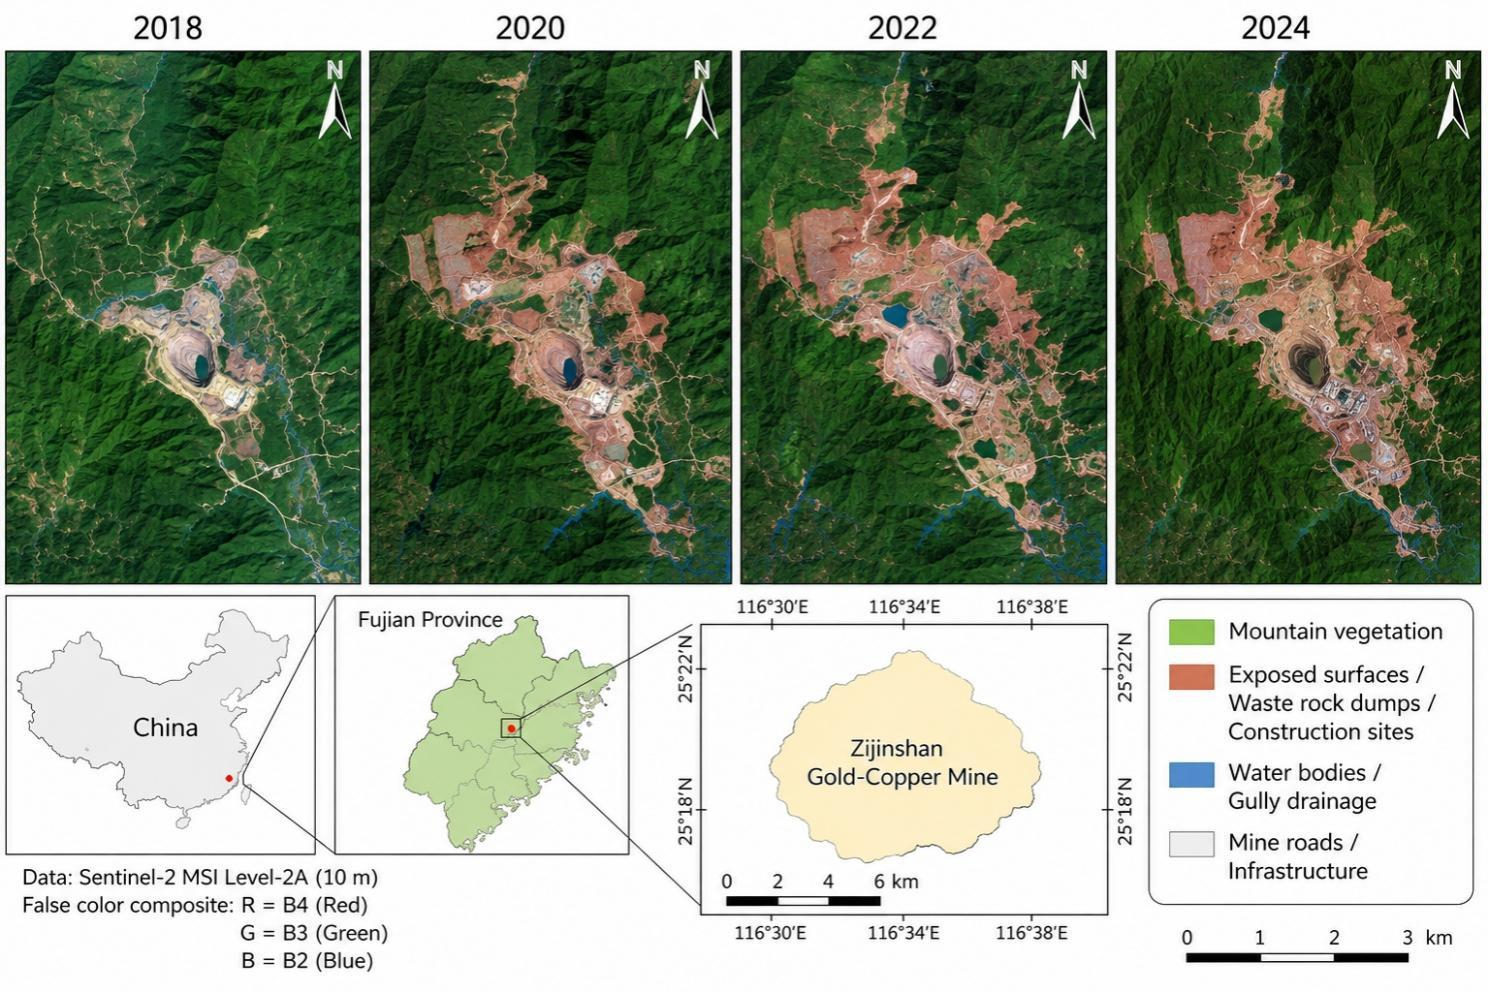
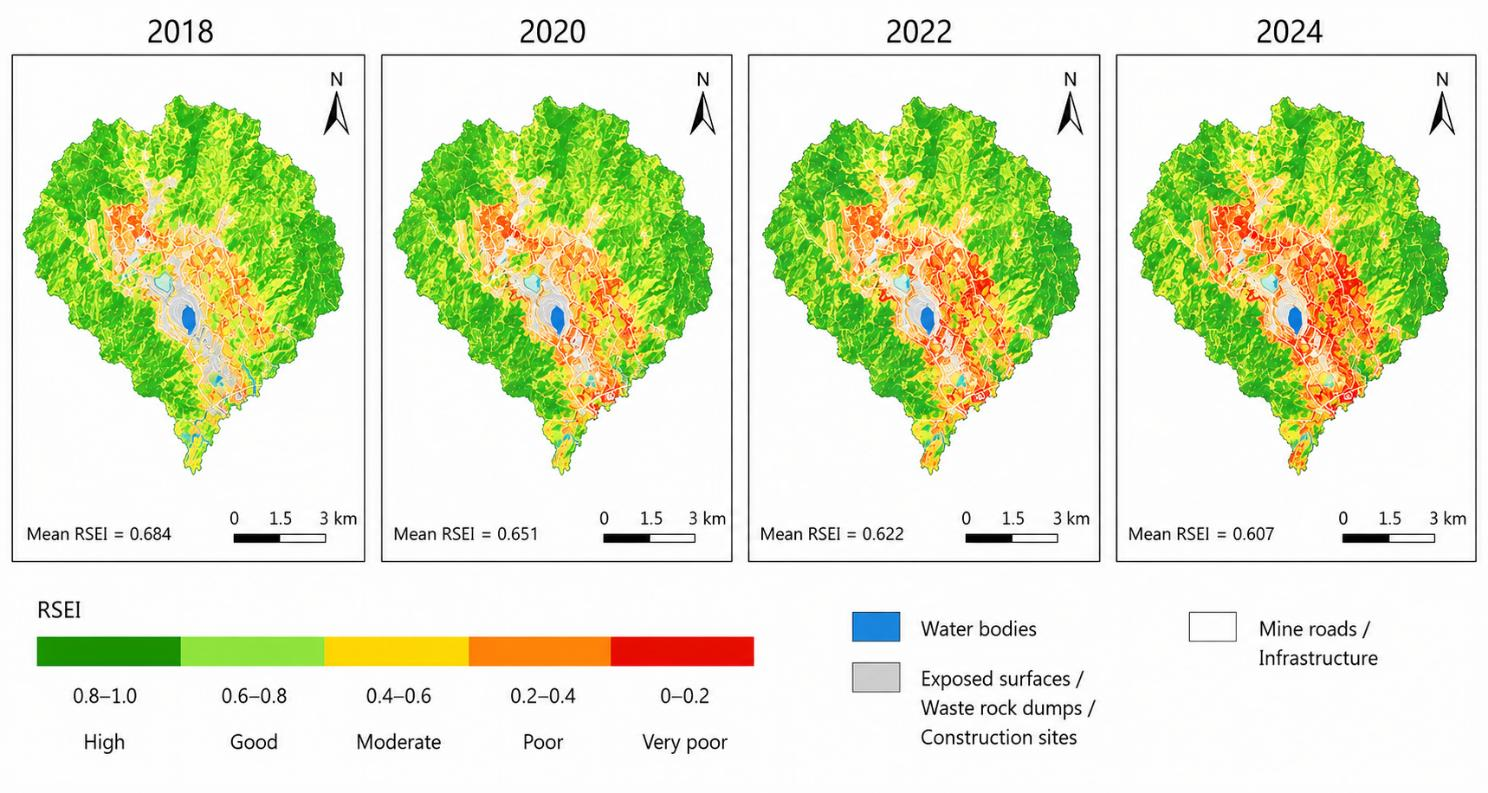
Time: Mar 2026 – Jun 2026 Authors: Junxiong Lai (First author), Peiyuan Xu, Yixian Huang* Venue: 2026 4th International Conference on Remote Sensing, Mapping and Geographic Information Systems (RSMG 2026) · Accepted; proceedings to be published by SPIE (indexed by EI Compendex, Scopus) Summary: Taking the Zijinshan Gold-Copper Mine in Shanghang County, Fujian Province as the case study, this paper constructs a dynamic monitoring framework for ecological disturbance in mining areas that integrates the Remote Sensing Ecological Index (RSEI), GIS spatial-constraint features, and a machine-learning classifier (GIS-LightGBM). Ecological disturbance is classified into five levels using multi-temporal Sentinel-2 and Landsat observations (2018–2024) together with terrain, distance, land-use and neighborhood texture features. Under spatial block validation, the GIS-LightGBM model achieves the best performance, with Accuracy of 0.934, Macro-F1 of 0.923, Kappa of 0.901 and Balanced Accuracy of 0.927, providing a technical reference for disturbance identification, restoration-priority delineation and remote-sensing dynamic monitoring in similar metal mining areas.
📄 Acceptance Letter (PDF)
Multiple Sentinel-2 color images of the Zijinshan Gold-Copper MineSpatial distribution of RSEI derived from remote sensing observations from 2018 to 2024
Research Projects
Machine Learning-Based Discrimination of High-, Intermediate-, and Low-Sulfidation Epithermal Gold Deposits Using Pyrite Trace Element Geochemistry
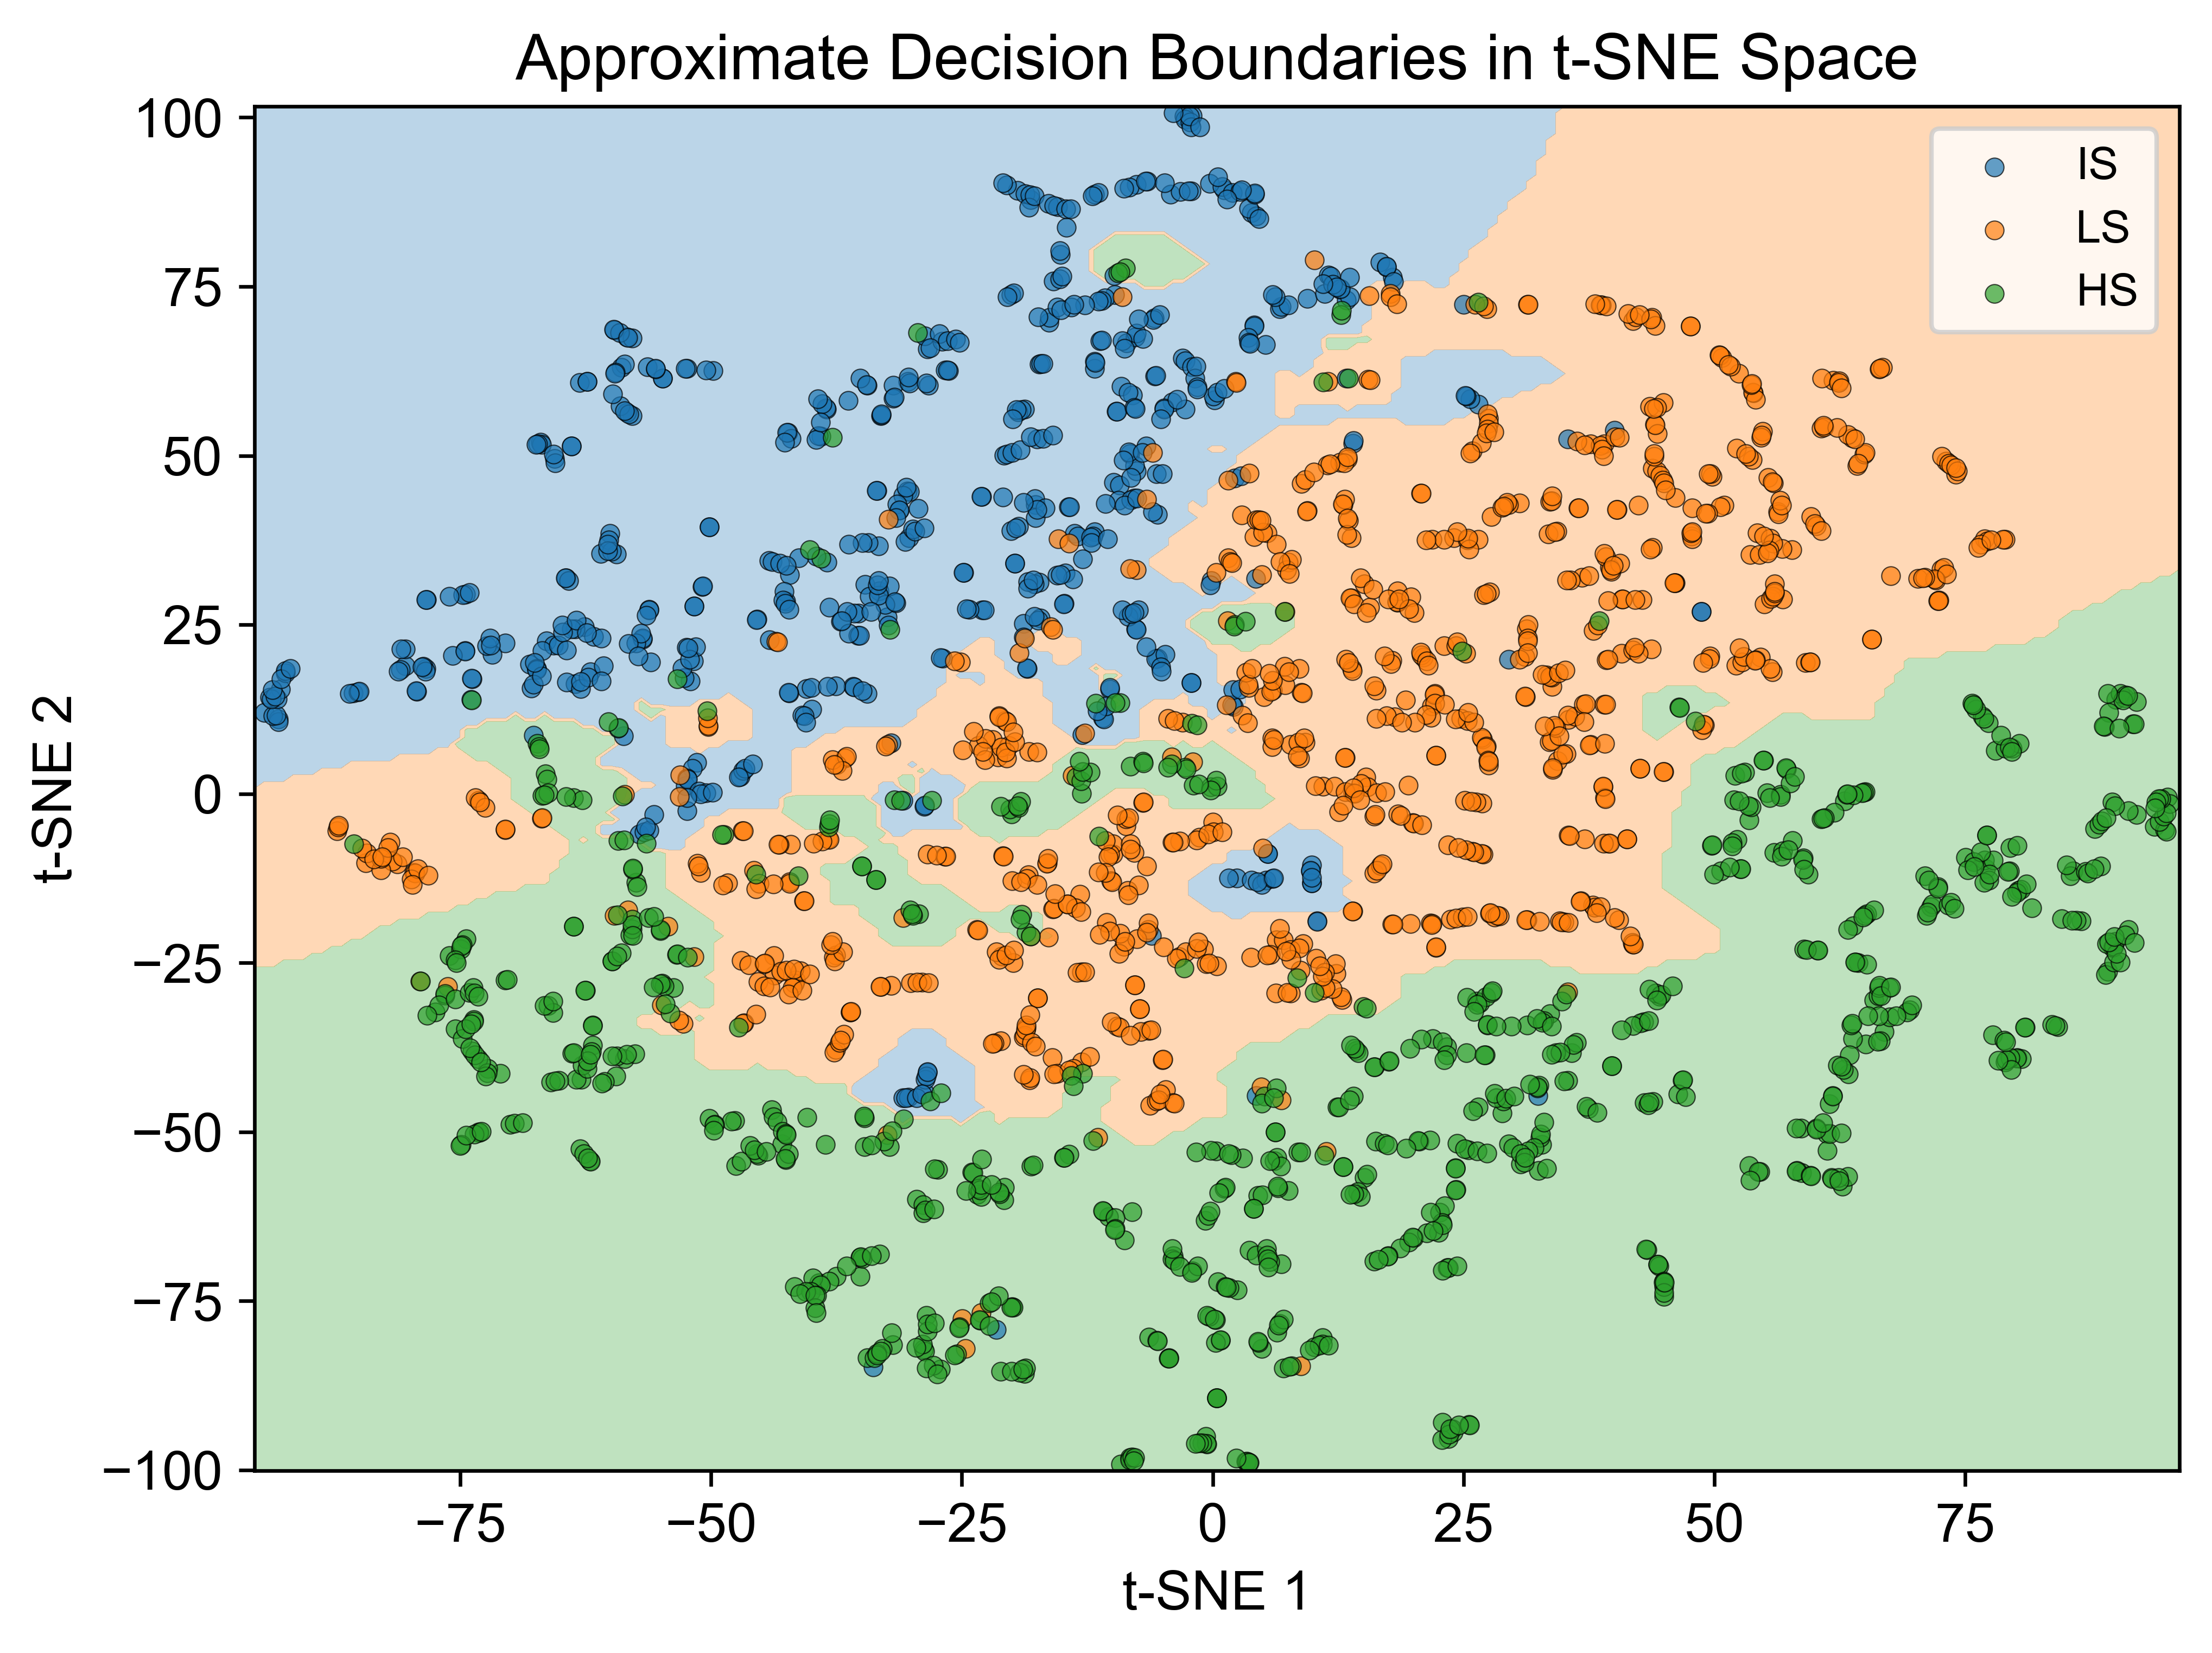
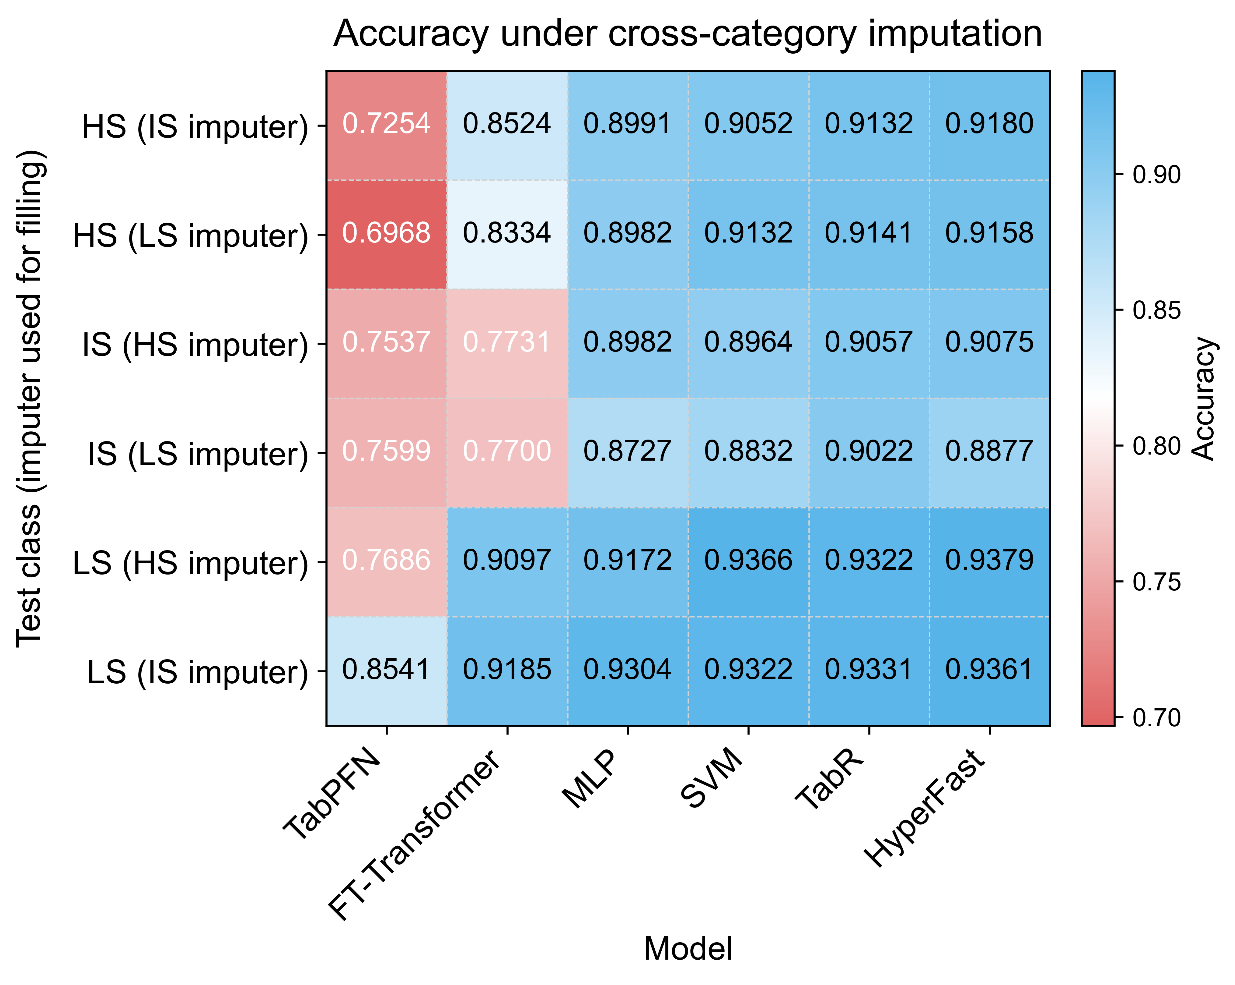
Time: Jan 2026 – Present Authors: Peiyuan Xu, Junxiong Lai, Lijie Liu*, Xunyu Hu, Wenyuan Liu Venue: Journal of Geochemical Exploration (JCR Q1, IF=4.6, manuscript submitted) Summary: This study applies seven machine-learning models (SVM, MLP, TabPFN, HyperFast, FT-Transformer, TabR and CatBoost) to 2,269 pyrite trace-element datasets collected from 17 representative HS–IS–LS epithermal gold deposits worldwide to discriminate deposit subtypes. All models achieve accuracy above 93%, with TabPFN, CatBoost and FT-Transformer exceeding 95%. SHAP analysis identifies Cu, Au, Mo, Sb, Te and Ni as the core discriminant elements.
Visualization of the classification boundaries of the three HS–IS–LS deposit types based on t-SNEDiscrimination results for unknown deposit classes under erroneous imputation
Ripples Across Regions: How Does R&D Investment Shape Carbon-Neutral Technology Innovation in China?
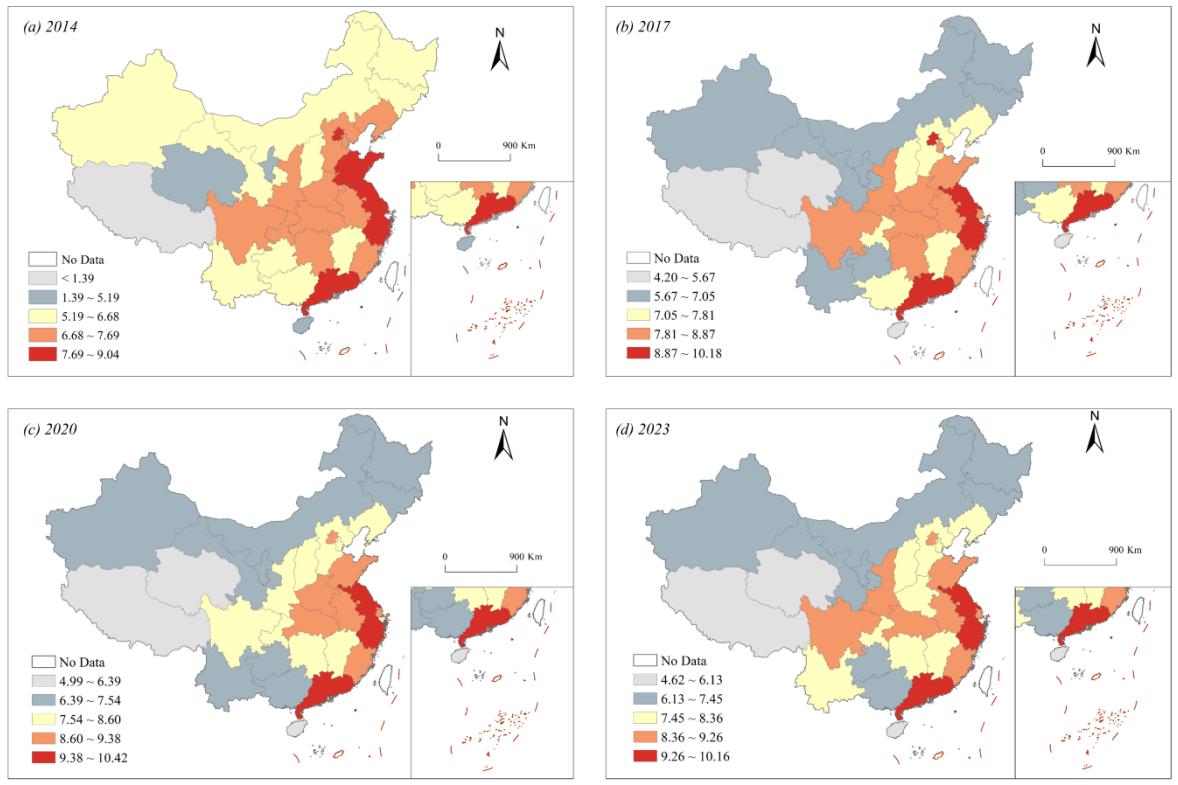
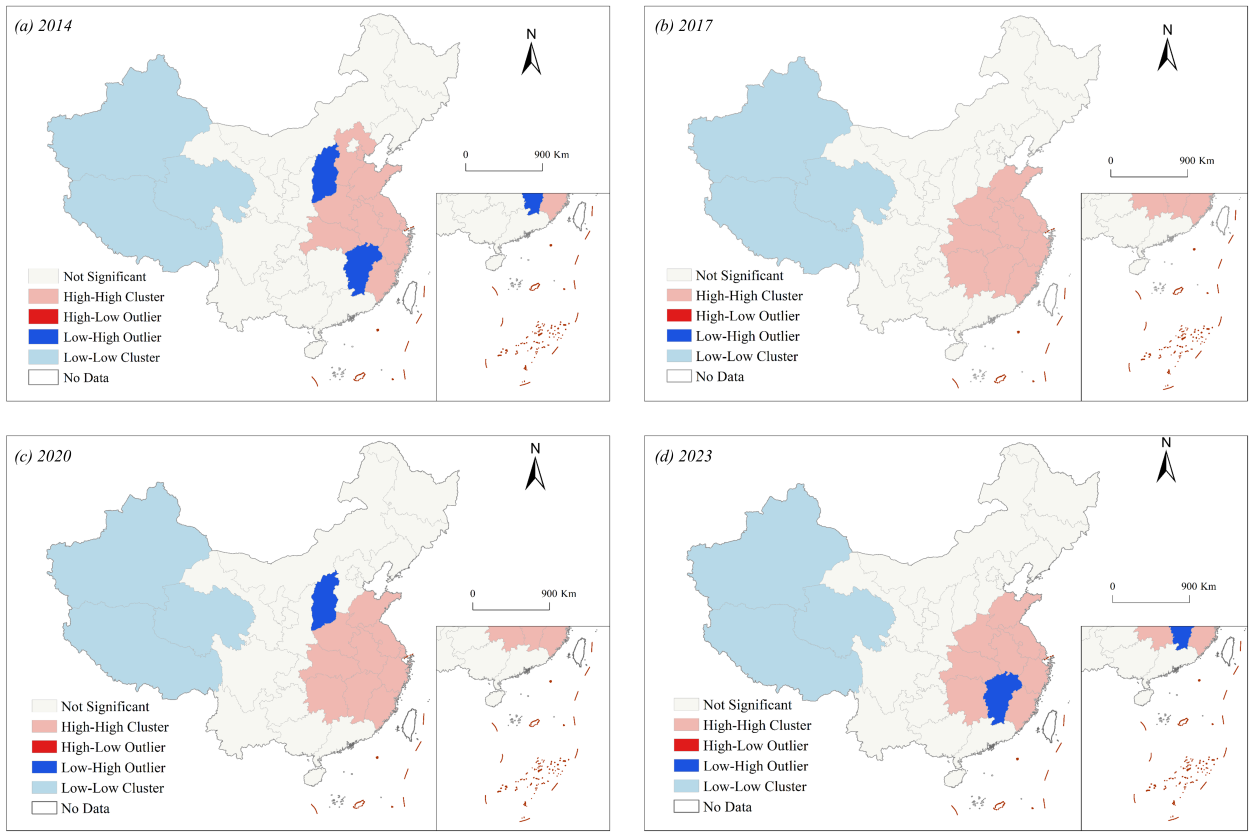
Time: Aug 2025 – Present Authors: Le Huang†, Zekun Su†, Junxiong Lai†, Ziyi Shi* Venue: Scientific Reports (JCR Q1, IF=4.9, manuscript submitted) Summary: Using panel data for 31 provincial-level regions of mainland China (2014–2023) and CPC Y02 patent applications as the measure of carbon-neutral technology innovation (CNTI), this study integrates spatial Markov chains, the spatial Durbin model and geographically and temporally weighted regression. We found that provincial CNTI exhibits significant positive spatial correlation and strong path dependence, and that medium-innovation provinces are more likely to transition upward in higher-innovation neighborhoods. R&D investment is positively associated with local innovation, while positive cross-regional spillovers are more pronounced than the direct local effect, and these effects remain robust under alternative innovation measures; local associations are generally positive, with non-stationarity concentrated mainly over time.
Spacial Distribution of CNTI in 2014, 2017, 2020 and 2023LISA clustering of CNTI in 2014, 2017, 2020 and 2023
† These authors contributed equally (co-first authors). * Corresponding author.